Threlte 3D-Dataviz Tutorial
Creating your first 3D data visualization using Threlte and D3
Over the past few years, Svelte combined with D3 have proven to be an
excellent combination for the creation of compelling data visualizations.
The declarative nature of Svelte combined with the powerful mathematical capabilities
provided by D3 allows you to whip out intricate datavizes without getting
lost in the sometimes complicated syntax of D3. So far this power combo has
mainly been limited to 2D data vizualizations that either use SVG or Canvas.
This however might all change with the maturation of the Threlte library.
What is Threlte?
Basically Threlte is a 3D framework for the web that is built on top of Svelte and Three.js. Three.js is a JavaScript library that streamlines the process of creating 3D animations and visualizations on the web. It provides a powerful set of tools for creating and manipulating 3D objects, and is built on top of WebGL, a web standard for rendering 3D graphics that harnesses the power of the users GPU.
Now Threlte allows you to create and render three.js scenes declaratively and state-driven in Svelte apps.” This means that you can use all the powerfull components of the three.js library, while taking advantage of the declarative syntax from Svelte. Threlte provides strictly typed components that allow you to quickly and easily build three.js scenes with deep reactivity and interactivity right out-of-the-box.
But wait, why would you consider creating 3D data visualizations?
For a long time, 3D data visualizations have had a poor reputation and they often remind us about the 3d flying piecharts you could make in the older versions of microsoft office. However, the field of data visualization has progressed significantly since then. Yes, 3D can distort perception and should therefore not be used for accuracy-heavy projects, but when you are looking to convey an idea or captivate your audience 3D graphs can be a great addition to your toolbox.
What to expect in this article?
- Setting-up Threlte locally
- Making our first scene with Threlte.
- Making a 3D barchart plot with Threlte
What not to expect:
This is not a beginner's guide to Svelte or D3. Furthermore it assumes a foundational understanding of HTML, CSS, and JavaScript. Prior knowledge of three.js is a nice, but for the scope of this tutorial not required. Are you new to Svelte or D3 or Three.js? Check-out these resources before you continue.
- Svelte: Svelte official tutorial
- D3: D3 official tutorial
- Three.js: Three.js tutorial
Important Note:
This tutorial makes use of Threlte 6 which is still in active development and you should expect breaking changes. This version of Threlte is currently available as a preview release and can be installed with the tag 'next'.
This tutorial makes use of Threlte 6 which is still in active development and you should expect breaking changes. This version of Threlte is currently available as a preview release and can be installed with the tag 'next'.
1. How to set-up Threlte locally
Creating a local environment
In this part we will look into how to set up Threlte on a local environment. To follow along, you'll need Node.js ≥v6.x and npm installed and set up with IDE of your preference.We start by setting up our Svelte environment by initializing Svelte-kit, the official application framework from Svelte. Open the terminal in your project folder and execute the following commands:
npm create svelte@latest ThrelteTutorialcd ThrelteTutorialnpm install three d3 @threlte/core@next @threlte/extras@next import { sveltekit } from '@sveltejs/kit/vite'
import { defineConfig } from 'vite'
export default defineConfig({
plugins: [sveltekit()],
ssr: {
noExternal: ['three'] }
});Now initialize the project with:
npm run devCreating our first scene
The Canvas component
Now we have our environment ready, we can start with setting up a <Canvas> component. This component stands at the root of your Threlte scene.<Canvas> sets up a renderer and predefines some useful configurations while also establishing a default camera and lighting setup, so you don't have to worry about those details when you start.
It's good practice to encapsulate your entire scene within the <Canvas> component. To do this, let's create a Svelte file named Scene.svelte and include it in the App.svelte file.
#App.svelte

<script>
    import { Canvas } from '@threlte/core'
    import Scene from './Scene.svelte'
</script>
<Canvas>
    <Scene />
</Canvas>
Adding an object to the scene
Let's move on to adding an object to our scene. As the goal of this tutorial is to create a bar chart, we'll start by creating a single bar. Setting up an object in Threlte requires three components - a geometry, a material, and a mesh. The geometry defines the structure of the object, while the material determines its appearance. Finally, the mesh combines the geometry and the material into a single object that can be placed in the canvas.With the traditional three.js library creating a box object will look like this:
const geometry = new THREE.BoxGeometry()
const material = new THREE.MeshBasicMaterial()
const mesh = new THREE.Mesh()

// "attaching" the objects to the mesh
mesh.geometry = geometry
mesh.material = materialThe main building block of the Threlte application is the <T> component. It's a generic component that we can use to render any Three.js object in a declarative way. By using Threlte we can rewrite the equivalent of the previous three.js code as follow:
#Scene.svelte

<script>
    import { T } from '@threlte/core'
</script>

<T.Mesh>
    <T.BoxGeometry />
    <T.MeshStandardMaterial />
</T.Mesh><T.MeshStandardMaterial color={'#B392AC'} />
Camera and light
Adding a custom Camera to our scene
As mentioned before, the <Canvas> component comes with a default camera. However for our scene we want to have a bit more control over our camera. We can do this by adding a Perspective camera component to our scene as follows:#Scene.svelte
<script>
import { T } from '@threlte/core'
</script>
<T.Mesh>
<T.BoxGeometry />
<T.MeshStandardMaterial />
</T.Mesh>
<T.PerspectiveCamera/>We can position the camera by providing the component with a position argument that takes an array with x, y and z coordinates. By default, the camera will look in a horizontal straight line. To make sure that the camera is pointed to our cube, we need to instruct the camera to look at the center of the scene as soon as it is created.
To accommodate this we will need to use a on:create event combined with a reference and the lookAt method.
#Scene.svelte

<script>
import { T } from '@threlte/core'
</script>

<T.Mesh>
    <T.BoxGeometry />
    <T.MeshStandardMaterial />
</T.Mesh>

<T.PerspectiveCamera
    makeDefault
    position={[20, 20, 20]}
    on:create={({ ref }) => {
    ref.lookAt(0, 1, 0);
}}/>Adding custom lighting to our scene
To make this scene a little bit more interesting we need to add some custom lights.The most commonly used light objects in Three.js are the ambient light and directional light. The ambient light globally illuminates all objects in the scene equally, but it does not cast shadows as it does not have a direction. This is where the directional light component comes in. The directional light emanates from a specific point and therefore requires a positional argument. By adding an intensity argument, we can adjust the light emitted by our light sources.
Let's add these lights to our scene as follows:
#Scene.svelte

<script>
import { T } from '@threlte/core'
</script>

<T.Mesh>
    <T.BoxGeometry />
    <T.MeshStandardMaterial />
</T.Mesh>

<T.PerspectiveCamera
    makeDefault
    position={[20, 20, 20]}
    on:create={({ ref }) => {
        ref.lookAt(0, 1, 0);
    }}
/>

<T.AmbientLight intensity={0.2} />
<T.DirectionalLight position={[10, 5, 0]} />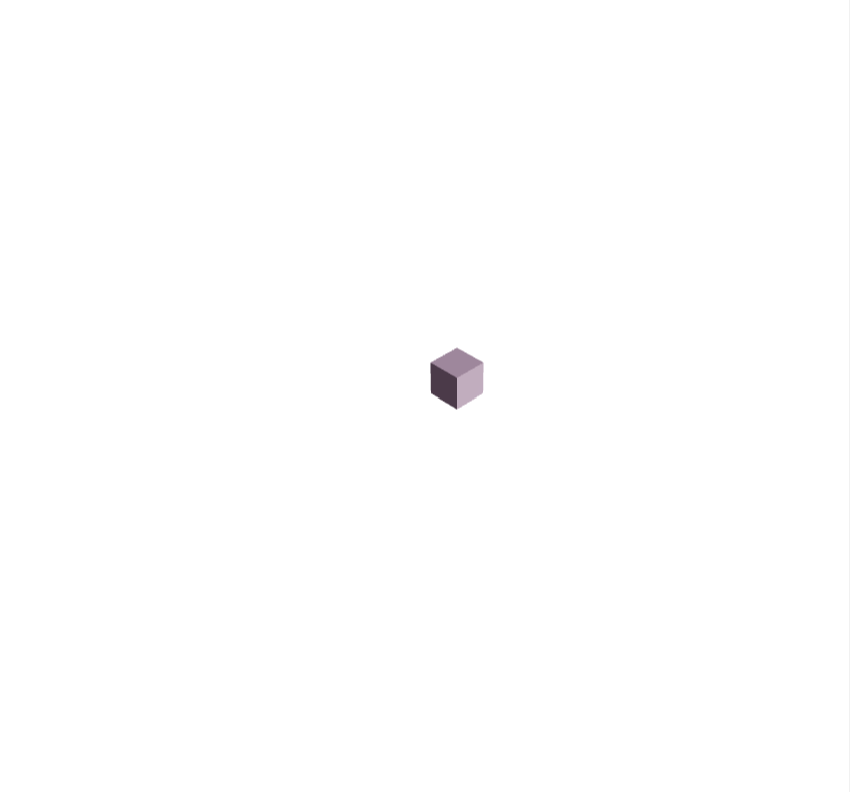
Transforming objects and casting shadows
Transforming objects
We can move the box by passing a position array as an argument to the T.Mesh component, similar to how we moved the camera and directional light earlier. However, we can also set the y position directly via a pierced prop using the dot notation position.y = 1 .This method has the computational benefit of not having to reassess the x and z positions when re-rendering the scene.In addition to position, we can also use arguments to rotate and scale our object. Since our goal is to create a bar chart, let's scale the y-axis of the object to transform our cube into a single bar.
#Scene.svelte

<script>
import { T } from '@threlte/core'
</script>

<T.Mesh scale.y={5}>
    <T.BoxGeometry />
    <T.MeshStandardMaterial />
</T.Mesh>

<T.PerspectiveCamera
    makeDefault
    position={[20, 20, 20]}
    on:create={({ ref }) => {
        ref.lookAt(0, 1, 0);
    }}
/>

<T.AmbientLight intensity={0.2} />
<T.DirectionalLight position={[10, 5, 0]} />
Adding a floor and casting shadows
In order to provide a more realistic sense of depth and dimensionality, we will add a floor to our 3D scene. To achieve this, we need to create a new Mesh object using a CircleGeometry and StandardMaterial. When creating the CircleGeometry, it is necessary to provide a constructor argument for the radius and number of segments that the circle will be constructed from. For our current purpose, 72 segments will suffice. Finally we will need to rotate the circle along the x axis so we can use it as a floor.#Scene.svelte
<script>
import { T } from '@threlte/core'
</script>
<T.Mesh scale.y={5}>
<T.BoxGeometry />
<T.MeshStandardMaterial />
</T.Mesh>
<T.Mesh rotation.x={-90 * (Math.PI / 180)}>
<T.CircleGeometry args={[30, 72]} />
<T.MeshStandardMaterial />
</T.Mesh>
<T.PerspectiveCamera
makeDefault
position={[20, 20, 20]}
on:create={({ ref }) => {
ref.lookAt(0, 1, 0);
}}
/>
<T.AmbientLight intensity={0.2} />
<T.DirectionalLight position={[10, 5, 0]} />#Scene.svelte
<script>
import { T } from '@threlte/core'
</script>
<T.Mesh castShadow scale.y={5}>
<T.BoxGeometry />
<T.MeshStandardMaterial />
</T.Mesh>
<T.Mesh receiveShadow rotation.x={-90 * (Math.PI / 180)}>
<T.CircleGeometry args={[30, 72]} />
<T.MeshStandardMaterial />
</T.Mesh>
<T.PerspectiveCamera
makeDefault
position={[20, 20, 20]}
on:create={({ ref }) => {
ref.lookAt(0, 1, 0);
}}
/>
<T.AmbientLight intensity={0.2} />
<T.DirectionalLight castShadow position={[10, 5, 0]} />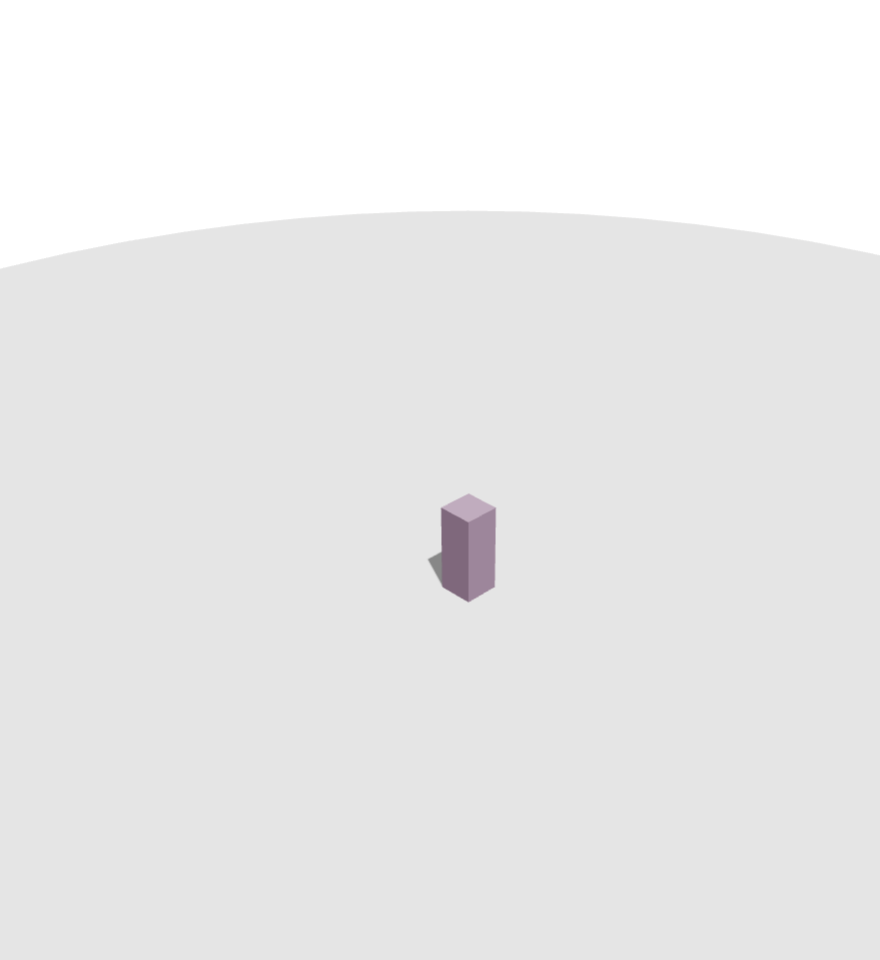
The Data, rainfall in Heathrow
Importing Data
To create a data visualization, we first need to import the relevant data into our scene. For this visualization, we will be analyzing the rainfall in Heathrow from 2010 to 2012. We can easily load the data in the correct format by using csvParse and autoType functions from the D3.js library. To begin, we need to import the D3.js library into our scene with:import * as d3 from 'd3'#Scene.svelte
async function load() {
const url= ‘https://raw.githubusercontent.com/stefanpullen/TutorialData/main/heathrow.csv’;
const response = await fetch(url);
if(response.ok) {
data = csvParse(await response.text(), autoType);
}
}
onMount(() => {
load();
});
D3 and 3D
Setting up D3 scales
Now that we have imported the data into our scene, we can start using the powerful scales of the d3.js library to map the values of our dataset to the Three.js canvas. We can use different types of scales depending on the data. For this visualization, we will use a linear scale for the y-axis and a categorical scale band for the x- and z-axes.To set up a scale in d3, we need to provide a domain and a range. The domain specifies the extent of the data we want to map. For the y-axis, we will use the temperature range (minimum and maximum) of our dataset, which we can easily obtain with the d3.extent method. For the x- and z-axes, we will use the unique values of the corresponding fields in the correct order.
Once we have defined our domains, we need to specify where these values will be mapped to on the screen by setting up the range of the scales. For our example, we will set the x-range from -10 to 10, the y-range from 0 to 5, and the z-range from 0 to 4. These are just relative values in Three.js, so you can adjust them according to your needs, as long as you also adjust your camera accordingly.
As we are loading the data asynchronously, we can take advantage of Svelte's reactivity to set our scales. This ensures that the scales will be updated as soon as the data is ready.
$: xScale = d3
    .scaleBand()
    .domain(data.map((d) => d.month))
    .range([-10, 10]);

$: yScale = d3
    .scaleLinear()
    .domain(d3.extent(data.map((d) => d.rain)))
    .range([0, 5]);

$: zScale = d3
    .scaleLinear()
    .domain(d3.extent(data.map((d) => d.year)))
    .range([0, 4]);
Creating a 3d bar chart
Let's create our first 3D bar chart now that everything is set up. It's a simple process that involves looping over our dataset using a Svelte Each block and utilizing the scales we created to determine the position and size of each bar.It's important to keep in mind that unlike SVG, Threlte centers the origin point on the object. Therefore, we'll need to adjust the y position by half of the bar's size to compensate for this.
Here's what the code should look like:
{#each data as d}
    <T.Mesh
        position.x={xScale(d.month)}
        scale.y={yScale(d.rain)}
        position.z={zScale(d.year)}
        position.y={yScale(d.rain) / 2}
        castShadow
    >
        <T.BoxGeometry />
        <T.MeshStandardMaterial color={'#B392AC'} />
    </T.Mesh>
{/each}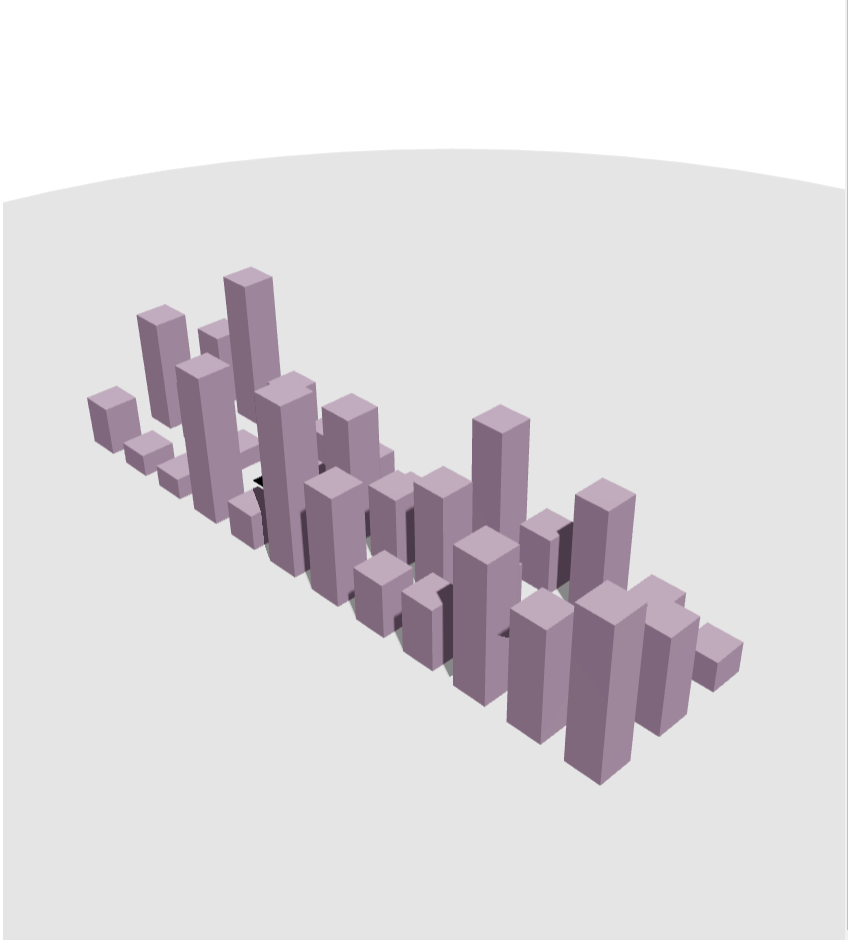
Refactoring
Creating svelte components
Before we wrap up, we can improve the readability of this project by setting up reusable components. First let's set up the bars component,Bar.svelte
<script>
import { T } from '@threlte/core';
export let x;
export let z;
export let y;
export let color;
</script>
<T.Mesh
position.x={x}
position.y={y /2}
position.z={z}
scale.y={y}
castShadow
receiveShadow
>
<T.BoxGeometry />
<T.MeshStandardMaterial {color} />
</T.Mesh>
The end of part 1
Great job! You have successfully completed part 1 of the Threlte dataviz tutorial. Throughout this section, we covered essential topics such as setting up a local environment, creating our first scene in Threlte, and ultimately, building our first 3D data visualization.
In the upcoming tutorial, we will further enhance our 3D visualization by adding annotations, animations, and interactivity. These advanced features will make our visualization more engaging and interactive, enabling us to convey our data more effectively.
See you in part2!
In the upcoming tutorial, we will further enhance our 3D visualization by adding annotations, animations, and interactivity. These advanced features will make our visualization more engaging and interactive, enabling us to convey our data more effectively.
See you in part2!